The Northern Ireland Commissioner for Children and Young People (NICCY) commissioned Social Market Research to undertake a survey of parents on the cost of education in Northern Ireland. The survey is based on a representative sample of 1006 parents. Parents were interviewed in the own home on a face-to-face basis using Computer Assisted Personal Interviewing (CAPI). Fieldwork was undertaken between 7 March and 10 May 2017.
Key Findings
Total Cost of Education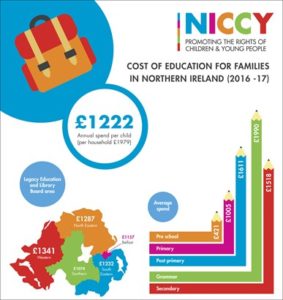
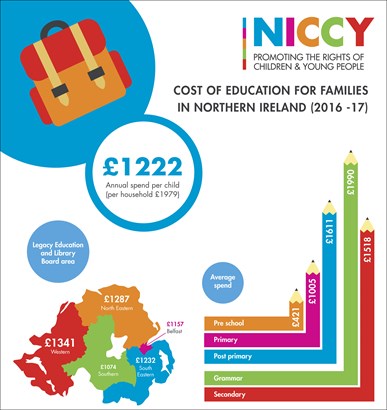
On average parents spent £1222.30 per child on education in the previous year;
▪ Parents spent an average of £421.21on pre-school children, £1004.64 on primary school children and, £1611.31 on children attending post primary schools;
▪ Parents with children attending controlled schools spent an average of £1286.14 per child (maintained, £1131.55: integrated, £1292.71);
▪ Parents with children attending secondary schools spent an average of £1517.85 per child with the spend on a child attending a grammar school estimated at £1989.70;
▪ Parents in the legacy Western Education and Library Board area recorded the highest average annual cost per child (£1341.29), whereas parents in the Southern Education and Library Board area (£1073.50) recorded the lowest cost;
▪ On average households spent £1979.18 on education costs in the last year;
▪ Households in the WELB area recorded the highest average annual spend (£2390.47) on education, whereas households in the SELB area (£1679.23) recorded the lowest average annual spendProportionate Spend by Item
▪ School meals accounted for 34% of all expenditure, with snacks accounting for 18%, transport 15%, and uniform 9%;
School Uniforms
▪ On average parents spent £109.39 per child on school uniforms in the previous year, or an average of £176.68 per household;
▪ 4% of all children in the survey purchased school uniform from schools directly, 49% from particular suppliers, 22% from both schools and suppliers, with 25% free to use any supplier;
▪ Among children required to purchase school uniforms from schools or particular suppliers, 71% were required to purchase all or most items from these sources;
PE Clothing, Footwear and Equipment
▪ On average parents spent £53.69 per child on PE clothing, footwear and equipment in the previous year, or an average of £84.29 per household;
▪ 4% of all children in the survey purchased PE related gear from schools directly, 31% from particular suppliers, 17% from both schools and suppliers, with 48% free to use any supplier;
▪ Among children required to purchase PE gear from schools or particular suppliers, 71% were required to purchase all or most items from these sources;
Equipment for Lessons
▪ On average parents spent £52.38 per child on equipment for lessons in the previous year, or an average of £84.53 per household;
▪ Among all children in the survey, 76% had purchased a school bag in the last year, with 69% purchasing pens / pencils and 58% other stationery;
Transport Costs
▪ 22% of all children in the survey were entitled to free school transport;
▪ On average parents spent £11.06 a week per child on transport, or an average of £16.32 per household;
▪ On average parents spent £431.34 per child annually on transport, or an average of £563.86 per household;
School Meals
▪ 29% of all children in the survey were entitled to free school meals;
▪ 42% of children in the survey took a school dinner, 33% a packed lunch, 7% bought lunch away from the school, 3% had lunch at home, and 15% sometimes had lunches or school dinners;
▪ On average parents spent £3.06 a day per child on school meals, or an average of £4.72 per household;
▪ The annual average cost of school meals for a child was estimated at £596.12, or an average of £920.61 per household;
Snacks and Drinks
▪ On average parents spent £1.58 a day per child on snacks and drinks, or an average of £2.43 per household;
▪ The annual average cost of snacks for a child was estimated at £308.71, or £474.58 per household;
School Fees and Voluntary Contributions
▪ 7% of all children in the survey paid school fees, with 30% asked to make a voluntary contribution to their school;
▪ Parents who had spent money on school fees and / or voluntary contributions spent an average of £59.59 a year per child, or an average of £73.56 per household;
▪ 29% of children in the survey attend schools where there is a requirement to pay a voluntary contribution, with 33% of their parents feeling under a lot or some pressure to pay the contribution;
Educational Visits
▪ 65% of children in the survey had paid for educational visits / class outings in the last year;
▪ Those who had spent money on educational visits / class outings spent an average of £21.29 per child in the last year, or an average of £30.19 per household;
▪ 6% of children were unable to take part in educational visits / class outings in the last year due to cost;
Additional Trips and Holidays
▪ 41% of children attend schools that organise additional, optional trips or holidays, that are not a class or subject trip;
▪ 39% of children had paid for additional trips and holidays at their school;
▪ On average additional trips and holidays cost £249.61 per child in the last year, with households spending an average of £348.10 on these trips in the last year;
▪ 7% of children were unable to take part in additional trips or holidays in the last year due to cost;
Charitable Donations
▪ 80% of children in the survey had made charitable donations, contributions for nonuniform days or sponsored activities in the last year;
▪ Among those who had made charitable donations in the last year, the average cost per child was £10.42, or £17.37 per household;
Before / After / Optional School Activities
▪ 34% of children in the survey pay for before / after / optional school activities on a weekly basis;
▪ Among those who had paid for before / after / optional school activities, the average weekly cost per child was £8.91, or £13.34 per household;
Homework Costs
▪ 36% of all children in the survey needed computer equipment, printers, access to the internet etc., to enable them to complete their homework in the last year;
▪ Among those who needed computer equipment etc. for their homework, the average cost per child was £77.42, or £103.03 per household;
School Fundraising Events
▪ 62% of children attended schools that held social fundraising events for pupils and/or parents in the last year;
▪ Among those who indicated that their child’s (ren’s) school ran fundraising events in the last year, the average cost per child was £12.97, or £21.61 per household;
▪ 7% of all children in the survey have special educational needs;
▪ Parents with children with special needs spent an average of £295 per child on additional items and activities relating to their child’s special educational needs, or an average of £364.41 per household;
Extra Tuition
▪ 5% of children in the survey incurred expenditure on extra tuition in the last year;
▪ Among those who had spent money on extra tuition in the last year, the average annual spend was £281.67 per child, or £364.41 per household;
Communication with Schools
▪ 25% of parents said they knew beforehand roughly how much it would cost to send their child (ren) to school [75% were unaware];
▪ 6% of parents said that cost was a factor affecting their choice of school for their child (ren);
▪ 21% of parents said they would be comfortable approaching their child’s school for financial help if they were struggling to pay the costs associated with sending them to the school [62% said they would be uncomfortable];
Impact of Education Costs
▪ 20% of parents agreed with the statement ‘My family has had to go without other things to pay for school costs’ [75% disagreed];
▪ 30% of parents agreed with the statement ‘I worry about finding/affording the money to cover the costs of sending my child (ren) to school’ [65% disagreed];
▪ 5% of parents reported getting into debt to pay their children’s education costs, with family the most common source of loan funding (58%);
▪ 2% of parents had used a payday loan service to pay for their child’s (ren) education costs;
▪ 34% of parents said there are more school costs at particular times of the year, with 60% of these parents most commonly citing September / first term / start of the school year;
Awareness that Schools Get Additional Funding for Children Entitled to Free School Meals
▪ 23% of parents were aware that, when a child is entitled to free school meals, the government also provides their school with additional funding;
▪ 57% of parents were supportive of making some of the additional funding (available to schools when child is entitled to free school meals) available to cover some of the child’s school costs that the parents are normally asked to cover;
Parental Expectations Regarding the Cost of Education in the Last Year
▪ On being provided with an estimate of how much they had spent on education in the previous year at the end of the survey, 40% of parents felt the figure was more than they had expected, with 56% saying it was about what they had expected and 4% said it was less than they had expected;
▪ 58% of parents believed that he cost of education estimated in the survey was ‘about right’, with 41% saying it was ‘too much’ and 1% saying it was ‘too little’.
You can read the full report here –NICCY Cost of Education Survey Report
Get Social